Too Many Requests from Your Network
Please complete verification to access this content.
When it comes to link building, the more options you have and the higher number of strategies you’re willing to employ, the better.
Below, we’ll dive deep into a subject many SEO experts and marketers tend to overlook, despite its great potential: infographics.
If you’ve never seen the point of using infographics for link building before, then the information below may change your mind…
What are infographics?
An infographic is a graphic that contains information— hence the name! Most infographics will be:
- Fact-based. Infographics are a great way of providing information in a simple, easily-digested form.
- Genuinely interesting. Infographics can be used to both educate and to entertain.
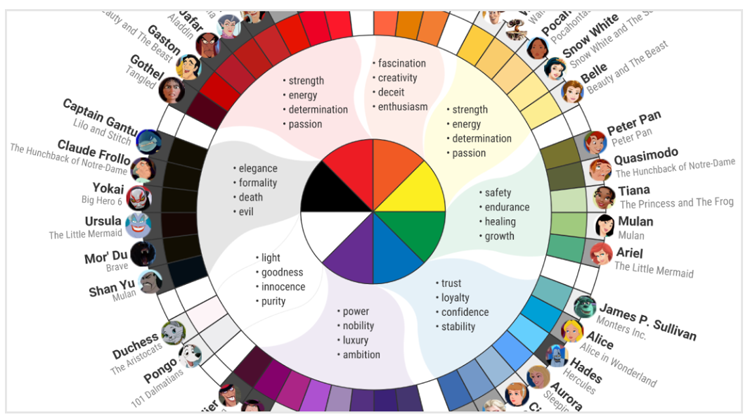
- A great example of this is the infographic on Disney villains and color psychology.
- Readers learn something, and they’re entertained by what they have learned.

- Infographics contain between 10 and 30 pieces of information, split into smaller groups and sub-sections for readability.
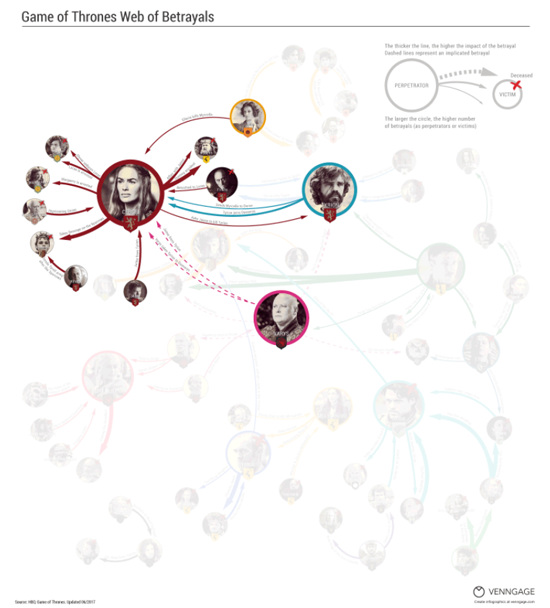
- Modern infographics are also able to incorporate newer design elements with animated and interactive features, such as this Game of Thrones infographic.

These elements help to increase shareability and give the information provided a contemporary dimension.
For a simple answer, infographics are essentially an article presented in image form— and they can be a great string to your link building bow.
Are infographics popular?
Yes, both for web users and marketers. In fact, research has shown that people are 30 times more likely to read infographics than a text-based article— and that’s not a typo, it really does say thirty.
Why are infographics useful for link building?
Infographics are used for link building for a variety of reasons.
The fact that they are popular for numerous reasons should alone make you keen to give them a try.
- Infographics can increase web traffic by 12%.
- Content that is posted along with relevant visual images (which an infographic is) are able to generate 650% more engagement than standard text posts.
- Infographics can help to build your brand as an authoritative source on a particular topic.
- Social media engagement is improved with infographics.
What kind of impact can an infographic really have?
To answer this question, we’re now going to take a more in-depth look at what an infographic can do in terms of link building.
We’ll be focusing on an infographic that was actually about infographic design: you can see the infographic itself here.

The effect that this infographic produced for the company behind it is, frankly, overwhelming. The stats speak for themselves:
- The infographic was embedded on 80+ websites, all of which contained a backlink to the creator.
- The infographic was pinned on Pinterest 130k+ times.
- The infographic had 600k+ views on Imgur.
- The infographic produced 145 live backlinks in total and 33 live referring domains.
- High authority links were obtained from HubSpot, Marketland Land, Ragan, and DesignTAXI— all of whom have DA 70+.
A single infographic was about to generate these kinds of results, which is staggering when compared to conventional forms of link building.
If you’re concerned this was a one-off success, then don’t be. There are plenty of other infographic case studies that demonstrate just how powerful a tool infographics are.
For example, this case study is about an infographic that led to a link from CNN and other authority sites.
Based on these compelling results, it’s easy to conclude that infographics need to be a part of your link building strategy.
How can you create infographics for your own link building purposes?
If the above stats have convinced you of the potential value of an infographic, you’re going to want to start the ball rolling on creating an infographic of your own.
The first step is choosing a topic. This, unfortunately, is easier said than done, but there are a few aspects you’ll want to keep in mind:
- Infographics seek to inform and potentially entertain, so you need to choose a topic that you can educate people on.
- The topic you choose should be relevant to your niche. Remember, one of the major upsides of infographic link building is that it can help establish your site as an authoritative voice within the niche, so relevance is key.
- The topic must be able to be visually represented. As a result of this, most infographics tend to be based on statistics and data.
- However, there are exceptions to this rule. Infographics on common grammar mistakes, for example, are not strictly data but they are informative— and they tend to be popular, too.
- The authority and reliability of an infographic are increased if you can find links that back up the information held within the infographic. So, if you are writing an infographic about internet user demographics, you can enhance the infographic if you are able to cite data from the Pew Research Center.
If you’re struggling, here are a few ideas you might want to consider.
- Subjects such as bullying, mental health, and poverty are also good choices for infographics. Some infographic designers specifically recommend that you choose emotive subjects that are likely to get people talking and wanting to share the article, so look within your niche to find an area people may have an emotional connection to.
- Explainers are always a good use of an infographic. Pick a new service and explain how to use it, providing step-by-step instructions and solving common queries. As an example, you could do an infographic about how to use Spotify. To find common queries about the subject, you can just Google: “in Spotify, how do you…” and wait for the search suggestions to pop up. Your infographic can then be designed to answer these frequent queries.
- You could also consider newsworthy items for your infographic. For example, if new legislation is passed, you could put together an infographic along the lines of: “What does [new legislation] mean for you?” and explain it in detail.
What information should be included?
One of the great benefits of infographics is that there aren’t really any rules so you can include whatever information you think is relevant.
However, for maximum effect, it’s preferable to consider the following:
- Only choose information that is accurate.
- Do not include information that could be considered to be subjective or biased. Instead, stick to facts that can be backed up by relevant data (and cite them wherever possible).
- Use the information that can be presented in short, easily-read chunks. Remember: one of the key benefits of infographics is that they are easier to read and remember than standard text. You don’t want to produce an infographic that is basically an article in graphic form, as this negates that benefit. Keep sections short, simple, and to the point.
Your infographic can be as long or as short as you need it to be. It’s best to choose a size of the infographic that reflects the information you have available.
You want to cover the topic in-depth, but you don’t want to include tenuous information in an effort just to make the infographic as long as possible.
How do I find a designer for my infographic?
You can hire an infographic design from some online sites, including Fiverr, Freelancer, and Upwork. If you’re handy with PhotoShop, you might even be able to create the design for yourself.
The golden rules for infographic design are:
- Clean
- Efficient
- Bright
- Easily read font
That aside, the design is largely down to your personal preferences.
What do you do with an infographic when it has been created?
When you have your infographic designed to your satisfaction,, you now have to put it to good use.
Your first step is to upload your infographic to your own site.
At the base of the infographic, include an infographic embed code that allows users to easily share the infographic on their own site.
There are plenty of embed code generators online: you could try this one, or install a WordPress plugin that performs the same function.

You also want to use an image sharer app that encourages viewers to share the infographic as they wish.
When the infographic is loaded onto your site and shareable, the real work begins.
- Advertising. It pays to promote your infographic with advertising. The more people that see it, the better.
- Social media. Link to your infographic on all of your social media accounts. Then, in a second update, post the infographic itself in the hopes of generating shares.
- Social sites. Share your infographic on sites such as Reddit, Digg, and other sites that allow user-generated content.
Outreach. Finally, infographic outreach is just as important as outreach for text posts. The more sites that share your infographic, the better. Look to outreach to blogs that are relevant to your niche and/or will provide an authority backlink. - Infographic link building outreach. An infographic is nothing without the right promotion. So to get it seen, you’ll need a highly effective tool like NinjaOutreach to help you promote your infographic. An efficient infographic link building promotion in detail is another story altogether, so to get that info, check out this NinjaOutreach guide on infographic link building promotion. In it, you’ll learn how to build more links using infographics by first finding social influencers and bloggers. You’ll then learn how to schedule an outreach campaign (complete with automated follow-ups) to promote your infographic. Finally, you can get examples and templates that you can use (and that are also used by professional marketers like Brian Dean from Backlinko.)
Benefits of using infographics
When searching online for facts and statistics, infographics are a favored option for online marketers and content writers to enhance the appearance of their own posts.
- Infographics are visually appealing. Infographics are more attractive than printed words, they combine images, colors, movement, and content that naturally draw the eye. Infographics enable us to quickly take in what’s important.
- Infographics are easily shared and shared more often. Infographics are amazingly shareable for use around the web. For instance, an infographic distributed on a WordPress blog or website usually has the option for an embed code. This makes it very easy to be placed on another site with a link back to yours.
- Infographics can increase brand awareness because they are so visually appealing. Infographics can be used to reinforce your brand by using regular colors, shapes, and messages, along with your logo.
- Infographics can help improve your SEO. A stylish infographic will drive individuals to your site, and they will often share or link back to it. When you get more links back to your website, generally, your website will increase in rank.
In conclusion
The benefits of infographics for link building are undeniable.
While infographics tend to take a little more work than text forms of marketing and link building, they also have the potential to offer a far higher return on investment.
If you’ve never conducted a link building campaign using infographics before, now might be the time to give it a try and experience this powerful tool for yourself.

