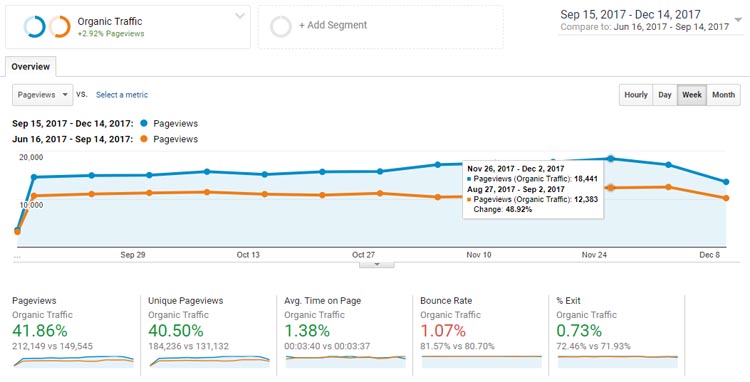
This case study is about a white hat, tiered internal linking SEO campaign that helped us boost our organic traffic by 40%.
Not sure if we’ve emphasized this enough, but we’re a fan of case studies.
From marketing to influencer outreach case studies, we’ve certainly curated our share.
This time, I’m going to share with you the results of our latest project—a white hat, tiered internal linking SEO campaign initiated by our founder, Dave Schneider, and co-executed by our SEO Manager, Tarek Dinaji.
Only a couple of months since we started this campaign, we’ve already experienced an over 40% increase in organic traffic!
Now that’s some solid proof right there.
Take note that we didn’t make any other optimizations during the period we were working on our internal linking SEO campaign, so we’re pretty sure we can mostly attribute the traffic boost to that strategy.
Ready to dive in?
Let’s start.
What You Can Expect
Background Story
Tools
Step 1. Download all relevant articles you need for the internal linking SEO campaign using Google Search ConsoleStep 2. Use Google Analytics to find the pages that have high conversions and engagement
Step 3. Based on data on the spreadsheets, compare article stats to analyze which ones to categorize into which tier
Step 4. Export all blog article data (titles and URLs) into a spreadsheet
Step 5. Use an SEO tool to view SEO stats then sort pages according to their ratings
Step 6. Use VLOOKUP to retrieve data from 2 worksheets
Step 7. Fill in the proper items in the formula to activate VLOOKUP
Step 8. Sort the data to finalize which articles to consider as Tier 1 pages
Step 9. Put Tier 1 articles up in the best positions
Step 10. Link to Tier 2 articles from Tier 1 articles, Tier 3 from Tier 2, and so on
Time Frame
Conclusion
How Our Internal Linking SEO Campaign Began
Here’s a little background story for how our internal linking SEO campaign began:
Some time ago, Dave came across this article about creating site architecture using the silo structure.
In essence, you divide all the pages in your website into silos, or topic themes, starting from the broader category, and further dividing them into related, more specific subtopics.
The goal is to create a more seamless crawling experience for search engine robots, as well as to distribute the link juice from your main content pages more equally.
Now, Dave thought of a better way he could use this strategy.
What if he divided all of his pages not into themes, per se, but hierarchies?
That is, all articles will be categorized by order of priority from tiers 1 through 3.
Top money pages would have to be tier 1.
These are the articles that rank for the exact keywords you are targeting, bring in the kind of traffic you want, and convert the most—or at least, that’s what you want these pages to do.
Tier 2 pages are those that are doing pretty well.
They attract good traffic and rank for certain keywords, but not necessarily the exact ones or at the level that you want.
Still, they bring a pretty good amount of views to your site.
Tier 3 pages are the lowest-performing pages.
They don’t get that much traffic or engagement and don’t rank well for any keywords that matter to you but are written well and could serve the occasional niche reader.
All of the highest-priority pages should show up everywhere that counts—the headers, footers, categories, etc.
Then, these tier 1 pages would link to tier 2 pages, and tier 2 pages to all the other tier 3 pages, thus sharing visibility and link juice to all pages on the website.
Intrigued, Dave set out to test it on another site he was working on: AvocadoPesto.
True enough, after two months, his idea got validated when traffic for AvocadoPesto’s articles shot up by 20%!
Dave didn’t do any other optimizations during this period as well, so he was pretty sure the changes can be attributed to the only updates he made: internal linking.
Convinced by now of the strategy’s effectivity, the idea to replicate the same process for NinjaOutreach was born.
And so, this article will discuss with you how we executed our internal linking SEO campaign and answer the following questions step by step.
- How did we collect all the articles we need?
- What tools did we use?
- What characteristics did we look for?
- How did we decide which articles to put into tiers?
- How did we decide which articles are in which tiers?
- How do we go about linking to them in the actual articles?
- How long before we checked back to see if we’ve gotten any results from this campaign?
Started campaign: August 31, 2017.
As of October 23, 2017, we already got a 40% increase in Traffic and around December 15, 2017, it got to almost a 50% traffic increase.
Tools Used
Aside from Google’s free tools, below are the other tools we used to complete our internal linking SEO campaign:
- Ahrefs – for identifying link authority.
- Moz – for identifying Domain and Page authority (DA and PA, respectively).
- NinjaOutreach – for exporting data (because it has automatic duplicate removal feature)
Step 1. Download all the articles using Google Search Console
To do this, go to:
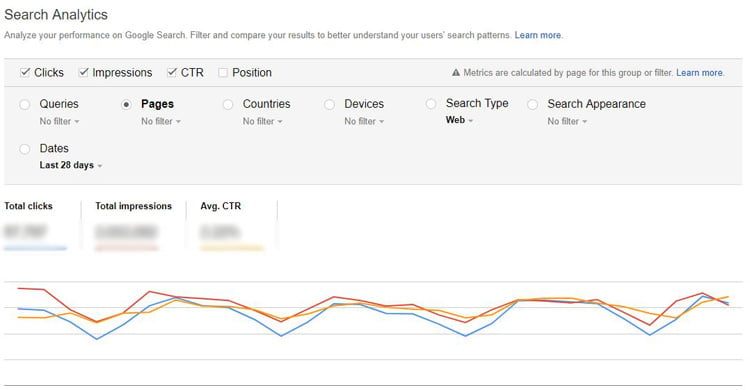
Google Search Console > Search Traffic > Search Analytics
Once there:
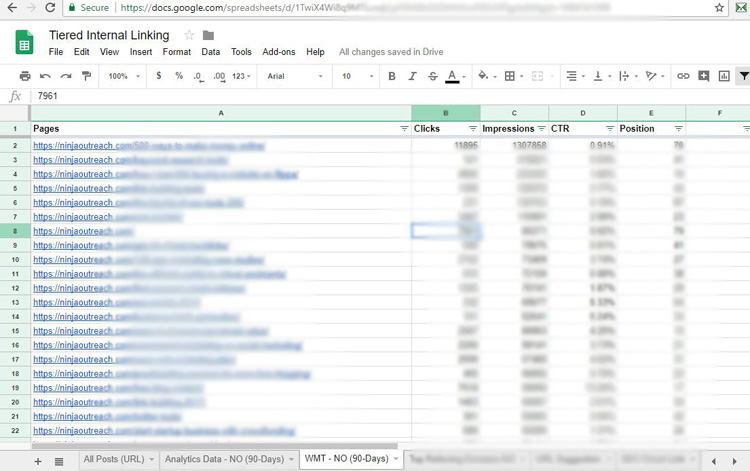
Tweak to display 500 rows > Download results into a Google spreadsheet > Clean up results manually (remove duplicates, non-blog pages, etc.)
Step 2. Use Google Analytics to find the pages that have high conversions and engagement
Go to:
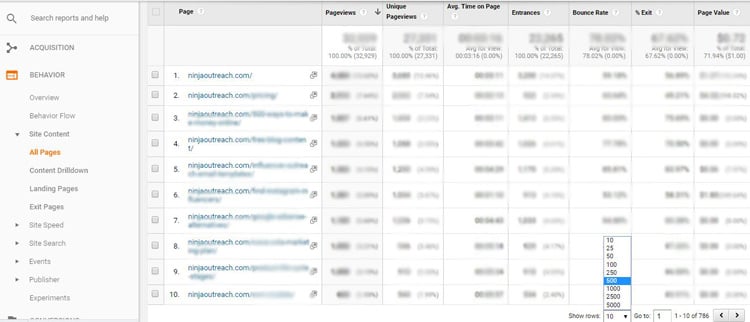
Google Analytics > Behavior > All Pages
Show 500 Rows, select View Full Report, then copy the data into a spreadsheet
Step 3. Compare article stats to analyze which ones to categorize into which tier
The stats you should look out for are:
- Impressions
- CTR
- Bounce rate
- Goal conversion
These give you the idea of how much value your article generates.
For example, an article with high impressions but low CTR means that Google thinks it’s a good article to prioritize in its SERPs, but the low CTR says that users who see it on the SERPs don’t find it relevant enough to click it.
Step 4. Export all blog article data (titles and URLs) into a spreadsheet
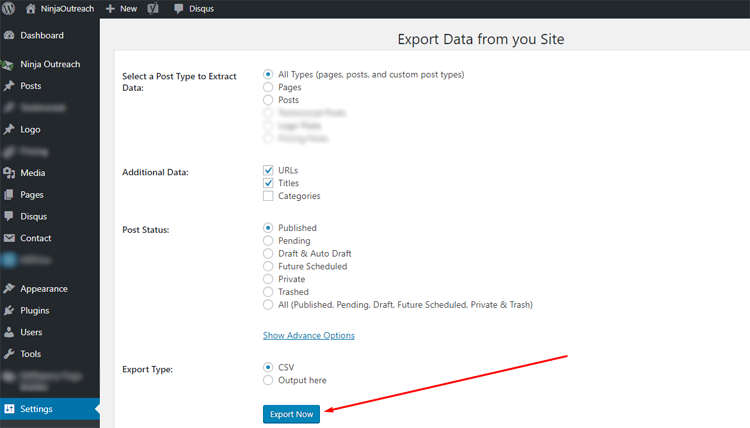
Since our site runs on WordPress, our SEO Manager Tarek used a WordPress plugin called Export All URLs to transfer all our data from the NinjaOutreach blog (titles and URLs) into a spreadsheet.
Step 5. Use an SEO tool to view SEO stats then sort pages according to their ratings
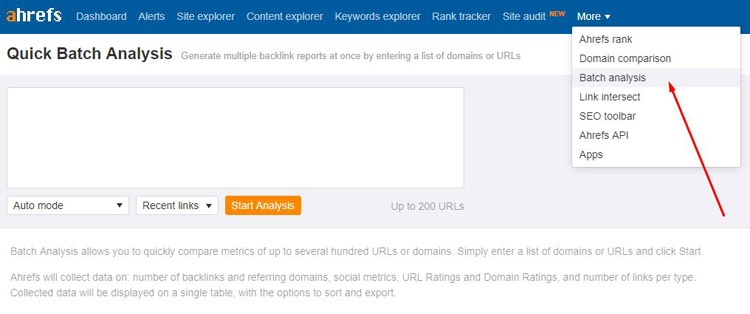
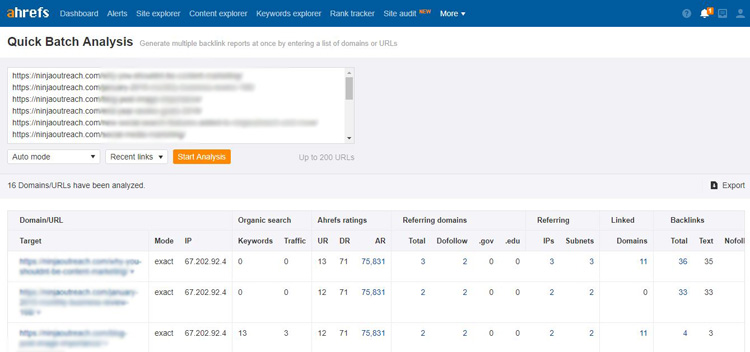
We used the Ahrefs Batch Analysis tool to see our SEO data.
We just grabbed the URLs from our sheet and pasted them into this input section.
We had to do this in batches because we can only apply batch analysis for up to 200 URLs.
We downloaded the results into a spreadsheet then copied only the UR ratings.
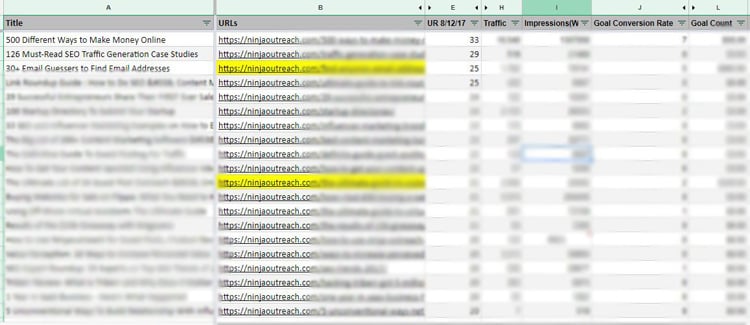
We then pasted this new data back to our original spreadsheet, making sure the UR ratings corresponded to the correct articles.
Next, we sorted them according to their UR ratings.
Note: UR rating is not the only factor for us considering which articles should be Tier 1. But it is one step to help us identify which articles are important.
This also helps us track the articles’ ranking improvements over time.
Step 6. Use VLOOKUP to retrieve data from 2 worksheets
VLOOKUP is a function that allows you to extract a column of data from separate tables by using an identifier that it has in common with another table.
These tables can either exist in the same worksheet, separate worksheets, or even different spreadsheets altogether.
When you’re working with a ton of data, VLOOKUP is a faster, more accurate way than a manual process. (VLOOKUP only works for data arranged in columns vertically.
For data arranged horizontally across rows, you can use HLOOKUP.)
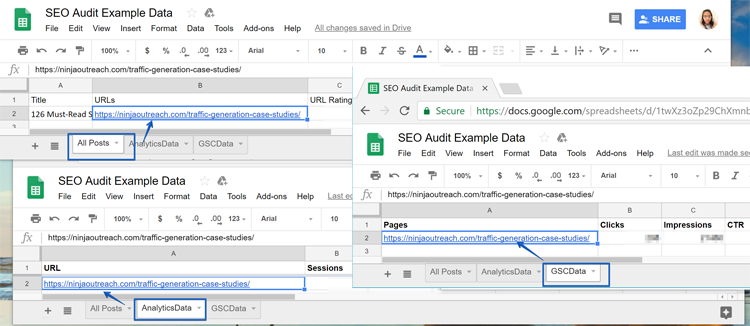
In our sample SpreadSheet, we have three worksheets:
- The All Posts worksheet, which contains all our blog post data imported from WordPress, and which should include all the final data that we need for the campaign
- The AnalyticsData worksheet, which contains all our Google Analytics Data
- The GSCData worksheet, which contains all our Google Search Console Data
In the All Posts sheet, we already have the Page URLs and the UR ratings we copy pasted from Ahrefs.
We still need other data from the other two sheets, AnalyticsData and GSC Data.
VLOOKUP will help us pull all that data together, and fast.
But first, let’s explain what our formula means.
The VLOOKUP formula (in Google Sheets) looks like this.
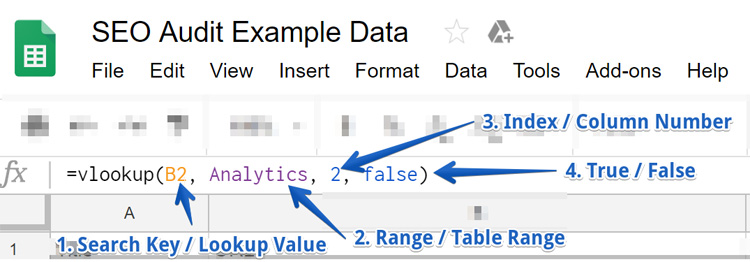
VLOOKUP(search_key, range, index, [is_sorted])
“=vlookup” simply defines the name of the formula you are using.
What we need to define is each of the items inside the parentheses, because those are the items you’ll need to change as you go along.
1. Search Key / Lookup Value
For VLOOKUP to work, you’re going to need to designate a unique identifier that your separate worksheets have in common.
It serves as a way to make sure the data you’re retrieving from one sheet matches with the data in the other sheet.
2. Range / Table Range
This is the range of cells where the search will run through. The first column in this range should contain the identifier.
3. Index / Column Number
This is the number of the column that contains the data or value that you’re looking for.
4. [is_sorted] / True / False
Dictates whether an approximate (True) or exact (False) match will be accepted.
Step 7. Fill in the proper items in the formula to activate VLOOKUP
In this section, we’re going to explain how we filled in the elements in our VLOOKUP formula.
If you check in our sample document, you’ll see how we entered the pieces we needed, and our formula ended up looking like this.
So to recap.
We have three worksheets:
- All Posts
- AnalyticsData
- GSC Data
What we want to accomplish:
- Extract the Sessions data from our AnalyticsData sheet
- Paste this data under the Traffic column in our All Posts sheet
- Make sure the data is for the same article (hence using the URL as the identifier).
To do that, we first need to define a name for the Range / Table Range.
Naming the Range / Table Range
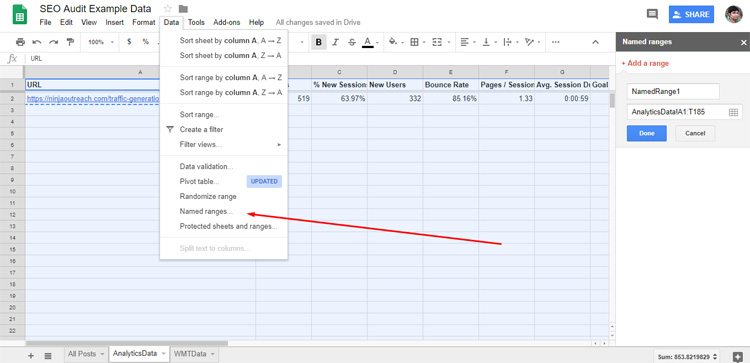
So, we will highlight the range that contains the Sessions column in the AnalyticsData sheet.
Next, click Data then Named ranges.
Define a name for your Range.
It should be something specific and easy to recall (in our case, we named it Analytics). Then, click Done.
Next, we went back to the All Posts worksheet and located the section (row or column) where we need the data to reappear.
We need our data from the AnalyticsData sheet to reappear under the Traffic column in our All Posts sheet.
The All Posts sheet is where we’ll be consolidating all the data we need so we will paste the VLOOKUP formula here.
Defining the Search Key / Lookup Value / Identifier
For the Search Key/ Lookup Value, we used the page URLs as our identifier, since all our worksheets have that value in common.
In our main sheet (All Posts) where we pasted the VLOOKUP formula, you’ll see that the cell number B2 contains our identifier, the page URL info.
So, we’ll enter that value (B2) into our VLOOKUP formula.
Again, this is a way to make sure the Sessions data we’re getting from the other sheet, AnalyticsData, is from the same article. (Defined by the same URL.)
Defining the Index / Column Number
The column number of the Sessions data that we need (situated from within the AnalyticsData sheet) is 2.
So we put that value into our VLOOKUP formula as well.
Defining [is_sorted] / True / False
For this process, just set the value to False.
Again, to recap, this is what the VLOOKUP formula should look like based on what I’ve explained above.
And there you have it. We just basically copied this VLOOKUP formula and adjusted the input items as the number of data we needed to process increased.
You can download our sample sheet complete with VLOOKUP formula through here.
Step 8. Sort the data to finalize which articles to consider as Tier 1 pages
Sort the final data according to Goal value and Goal count to see which ones are money articles (the pages that make the most money for the business).
Money articles are the pages where visitors convert and also the pages that contain content with topics that are highly relevant for our target readers or that we want to rank.
These are automatically tagged as Tier 1 pages.
Next, we also looked at how much traffic a page has gotten as well. If the topic is relevant to our business, we can add it to our Tier 1. If not as much, it goes to Tier 2.
Tier 3 pages are the pages that rank low on both ratings.
Step 9. Put Tier 1 articles up in the best positions
Once we’ve identified which articles we wanted to be more visible, we put them up in the best places where our target readers will more likely see them.
These sections are typically our home page and page footer.
There’s also now a higher chance to convert using these new articles because we’ve ensured that they are the type of articles that resonated with our most profitable customers (MPCs).
Step 10. Link to Tier 2 articles from Tier 1 articles, Tier 3 from Tier 2, and so on
Rule of thumb: 1 link per 100 words.
The main goal is to surface the money articles at the top and make room for other Tier 2 and Tier 3 articles.
If the actual article content does not have an opportunity for linking straight from the body using relevant keywords, you can also add a “related story” section at the bottom and link out to a Tier 2 or 3 article.
Tier 1 in the header and footer, then under that tier 2s, then under those, tier 3s.
When linking out, the key is to make sure that they are topically related.
If it’s not contextual, don’t insert the link in an article just because a spreadsheet dictates that you need to.
What if an article doesn’t fit the context of the main post you will link from?
There are ways to get around this.
If an article you need to link to doesn’t fit anywhere in the main post you’re linking from, add the articles you need to by linking to them via sections like:
- You Might Also Like This Article
- Related Articles
- Other Featured Articles
- Related Stories
- Related Reading
- Etc.
You can also create a different category in your blog menu and add about 5 or 6 more Tier 1 articles.
You can even try other ways such as adding more categories, creating sub-categories in your home page, etc.
This is what we did, and so far, it has worked well for us.
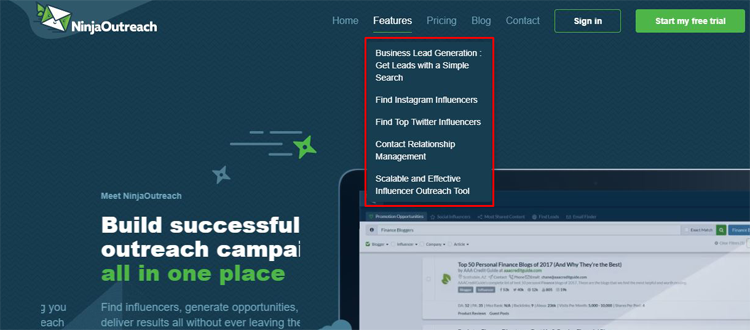
For example, here’s a screenshot of the header where we inserted some of our Tier 1 articles.
How many pages can you use for your Tiers?
Technically, it depends on how many pages you have that are doing great, and how much space you have to feature those pages on.
Allocating this would be like doing prime factorization.
It’s all a matter of how many links you can display per page of content.
In our case, the number of links we could display on our homepage limited how many Tier 1 articles we could have.
Since we could only display five on our menu and seven in the footer, that gave us space for 12 Tier 1 articles.
Second, if a site has thousands of articles, for example, then there should be at least a hundred Tier 2 articles.
That will give you enough real estate to link to your Tier 3s.
NinjaOutreach had around 300 total articles at the time we did our internal linking SEO campaign, so we divided those accordingly.
For every hundred articles, our SEO Manager Tarek selected 10 Tier 2 articles. So for around our 300 total, we ended up with 30 Tier 2 articles.
Also, since we did not have more than 10 linkable Tier 1 articles, we had to choose only 30 Tier 2 articles.
Try to link to all of your Tier 3 articles where they make sense but don’t sweat it if you can’t find any appropriate sections to put them in.
Timeframe
To analyze your internal linking SEO campaign results, you need to wait at least one month before recording progress.
However, you can observe immediate changes in Google Analytics.
Full changes should be visible within three months.
In our case, we saw some immediate DA/PA increase.
But as we’ve already shown in our intro, it was the almost 50% traffic increase that ultimately validated out strategy.
Conclusion
And there you go! A complete step-by-step walkthrough of the internal linking SEO strategy we used to boost our organic traffic by almost 50%.
You can also download the sample sheet complete with VLOOKUP formula that we used here.
Try it out, and let us know how this strategy affected your traffic!

